
A warehouse can run at full capacity and still lose money if nobody’s watching the numbers. Supply chain KPIs ecommerce show sellers exactly where orders slow down, where stock sits too long, and where returns quietly eat into margin.
Skip them, and you find out about problems from angry customers, not your dashboard.
What Are Supply Chain KPIs in Ecommerce?
Supply chain KPIs in ecommerce are measurable indicators that track how efficiently a seller’s inventory, fulfillment, delivery, and returns processes are performing.
Each KPI attaches a number to one part of the order journey, so you can see performance instead of guessing: how fast a warehouse ships, how often deliveries land on time, how much stock goes unsold.
Traditional retail KPIs were built around store shelves and predictable buying cycles.
Ecommerce compresses that timeline, and a stockout on your bestseller can mean a customer buys from a competitor instead and never comes back.
The KPIs below are grouped by where they show up in the order journey, so you can see exactly which part of your operation each one is holding accountable.
Inventory & Planning KPIs
These three metrics show whether your stock is working for you or quietly tying up your cash.
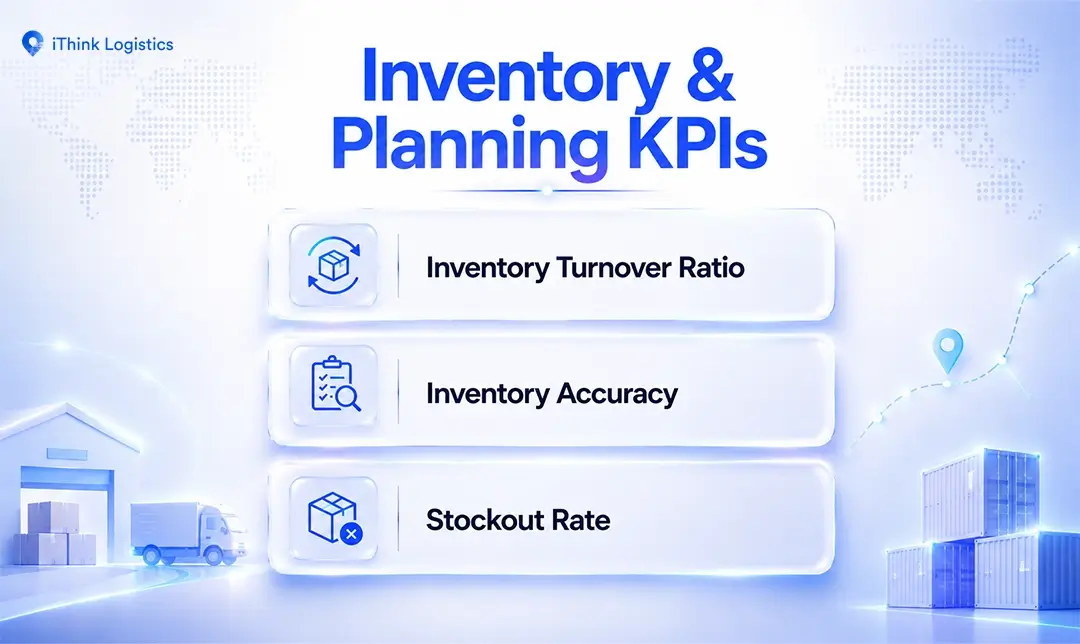
Inventory Turnover Ratio
Inventory turnover ratio measures how many times a seller sells and replaces its entire stock within a set period, usually a year.
Formula: Inventory Turnover = Cost of Goods Sold ÷ Average Inventory Value
Example: Inventory Turnover = ₹40,00,000 ÷ ₹8,00,000 = 5
This means a seller with an annual COGS of ₹40,00,000 and average inventory value of ₹8,00,000 sells through and replaces its entire stock five times a year, or roughly once every 2.4 months.
A higher ratio generally means stock moves fast and cash isn’t sitting on a shelf.
However, what counts as “good” varies significantly by category and business model, so this is a number worth tracking against your own history and category peers rather than a fixed universal target.
Low turnover during peak season can signal excess inventory, especially when demand for that season was overestimated.
Inventory Accuracy
Inventory accuracy is the percentage match between what your system says you have in stock and what’s actually in the warehouse.
There are two standard ways to calculate it:
- Simple Count Formula
- Variance-Based Formula.
The Variance-Based version is more precise, since it accounts for both overages and shortages as errors rather than just checking whether the counts match.
Formula (Variance-Based Method): Inventory Accuracy = [1 − (|System Count − Physical Count| ÷ System Count)] × 100
Here, “variance” means the gap between what your system says you have and what’s physically on the shelf, regardless of whether you have more or less than recorded.
Example: Inventory Accuracy = [1 − (|500 − 480| ÷ 500)] × 100 = 96%
This means a seller whose system shows 500 units in stock, but a physical count finds only 480, has a 96% inventory accuracy rate for that SKU.
Multi-channel selling can make inventory synchronization harder, particularly when stock updates are delayed or systems aren’t fully integrated.
APQC (American Productivity & Quality Center), a nonprofit that benchmarks operational performance across industries, measures variance between physical and system counts and currently reports a 95% median across its sample.
That’s a useful reference point, since lower inventory accuracy increases the risk of stock discrepancies, stockouts, and overselling.
Stockout Rate
Stockout rate tracks how often a customer wants to buy a product and can’t find it available.
There are three standard ways to calculate it:
- Demand-Based Rate
- Order-Based Rate
- Time-Based Rate
The Demand-Based version is the most common for ecommerce, since it captures every missed purchase attempt rather than just unfulfilled orders or days out of stock.
This is generally calculated monthly, though sellers tracking fast-moving or seasonal SKUs often check it weekly, and slower categories may only need a quarterly view.
Formula (Demand-Based Rate): Stockout Rate = (Stockout Orders ÷ Total Demand Requests) × 100
- Stockout Rate: the resulting percentage, showing how often demand went unmet
- Stockout Orders: the number of times a customer tried to order a product and it was unavailable
- Total Demand Requests: the total number of times customers tried to order that product, whether it was in stock or not
Example: Stockout Rate = (15 ÷ 500) × 100 = 3%
This means a seller who had 15 stockout incidents out of 500 total customer requests that month has a 3% stockout rate.
There’s no single universal cutoff for what’s acceptable here, since it depends on your category and service-level goals.
A stockout can mean a lost sale, a substituted product, or a customer turning to a competitor.
Bestsellers deserve tighter safety stock and more frequent reorder checks than slow-moving SKUs.
Fulfillment KPIs
Once an order is placed, these two metrics show whether your warehouse turns it around cleanly or creates problems downstream.
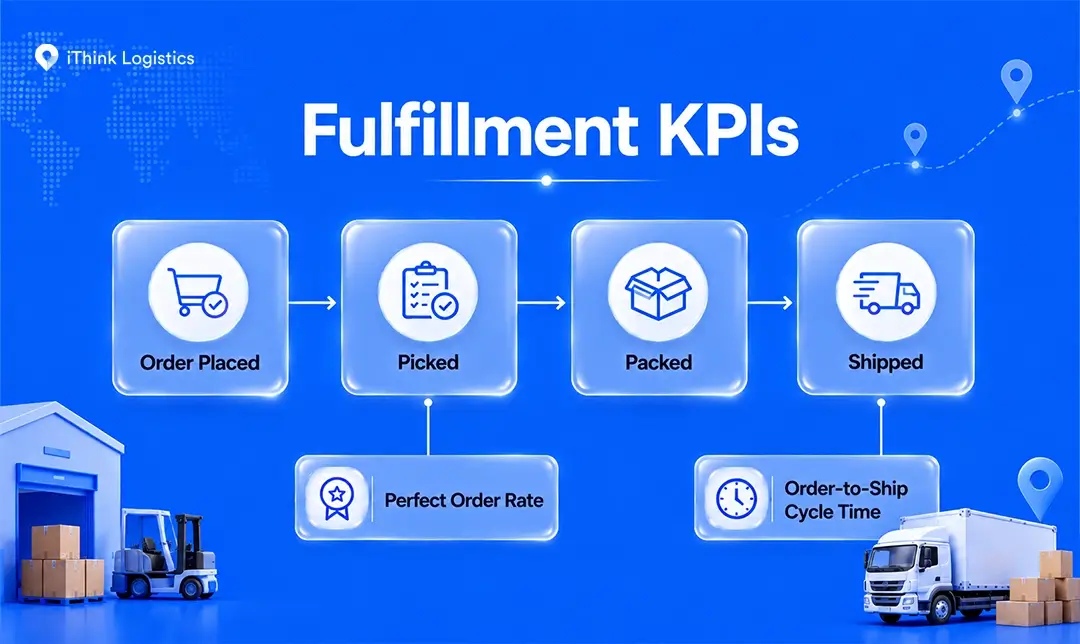
Perfect Order Rate
Perfect order rate measures the share of orders delivered on time, in full, damage-free, and with accurate documentation, all four conditions met together.
There are two standard ways to calculate it:
- Direct Count Method
- Compound Component Method
The Direct Count Method divides the number of fully error-free orders by the total number of orders.
The Compound Component Method multiplies the success percentage of each of the four stages together, which is more useful when you’re tracking each stage separately rather than auditing every order end-to-end.
Formula (Compound Component Method): Perfect Order Rate = % On-Time × % In-Full × % Damage-Free × % Accurate Documentation × 100
- % On-Time: the share of orders delivered by the agreed date
- % In-Full: the share of orders delivered with the correct items and exact quantities
- % Damage-Free: the share of orders that arrived in good condition
- % Accurate Documentation: the share of orders with correct invoices, labels, and paperwork
Example: Perfect Order Rate = 0.95 × 0.95 × 0.98 × 0.97 × 100 ≈ 86%
This means that even if each stage looks strong at 95-98% on its own, the combined perfect order rate comes out closer to 86%, since every order has to clear all four stages to count as perfect.
This metric is useful as an overall scorecard because it combines several fulfillment outcomes into one measure, rather than looking at any single step in isolation.
APQC’s benchmarking currently puts the median perfect order rate across companies at around 88%, a useful reference point since it reflects real company data rather than a single blended average.
Order-to-Ship Cycle Time
Order-to-ship cycle time measures the average time between a customer placing an order and that order shipping out from your warehouse, across all orders in a given period.
Formula: Order-to-Ship Cycle Time = Sum of (Ship Date − Order Date) for All Orders ÷ Total Orders Shipped
- Ship Date: the exact moment the packed order leaves your warehouse or is handed to the courier
- Order Date: the exact moment the customer places the order
- Total Orders Shipped: the number of orders shipped within the period you’re measuring, such as a week or a month
Example: Order-to-Ship Cycle Time = 150 days ÷ 100 orders = 1.5 days
This means a seller who shipped 100 orders in a week, with a combined order-to-ship time of 150 days across all of them, averages 1.5 days per order.
This is worth naming carefully. The related metric “order-to-delivery cycle time,” often called lead time, uses the same structure but runs through the actual delivery date instead of the ship date, so it captures courier transit time as well. Order-to-ship time only measures your warehouse’s internal speed, stopping the moment the package leaves your facility.
There’s no universal target here, since it depends heavily on your warehouse capacity and order volume. Set an internal cutoff-based goal and track it consistently.
Delivery & Last-Mile KPIs
Delivery is where operational performance becomes a customer’s experience of your brand.
On-Time Delivery Rate (OTD / OTIF)
On-time delivery rate tracks the percentage of orders that reach the customer by the date promised at checkout.
OTIF (on-time in-full) is a stricter version of the same idea that also requires the order to arrive complete.
Formula (OTD): OTD = (On-Time Deliveries ÷ Total Deliveries) × 100
Formula (OTIF): OTIF = (On-Time and In-Full Deliveries ÷ Total Deliveries) × 100
- On-Time: the order reaches the customer on or before the promised delivery date
- In-Full: the shipment contains the exact quantity and items requested, with nothing missing or damaged
Example: If 950 out of 1,000 deliveries arrive on time, OTD = (950 ÷ 1,000) × 100 = 95%. If only 900 of those 950 also arrive complete, OTIF = (900 ÷ 1,000) × 100 = 90%.
This gap between OTD and OTIF exists because of what’s sometimes called the dual failure rule: if an order arrives on time but is missing even one item, it counts as a failure for OTIF, even though it would still pass as a success for OTD.
That’s why you don’t treat OTD and OTIF as interchangeable, and why OTIF is always equal to or lower than OTD, never higher.
95% or higher is often used as a strong OTD benchmark, though actual performance varies by industry, geography, and courier serviceability.
First-Attempt Delivery Rate
First-attempt delivery rate is the share of orders successfully delivered the first time a courier tries, without needing a second trip, a reschedule, or a return.
Formula: First-Attempt Delivery Rate = (Orders Delivered on First Attempt ÷ Total Delivery Attempts) × 100
- Orders Delivered on First Attempt: orders successfully handed to the recipient on the first dispatch, with no second trip needed
- Total Delivery Attempts: all initial delivery attempts made within the period you’re measuring
Example: First-Attempt Delivery Rate = (900 ÷ 1,000) × 100 = 90%
This means a courier that made 1,000 delivery attempts and succeeded on the first try for 900 of them has a 90% first-attempt delivery rate.
A high rate, generally above 90%, usually means your address data and route planning are working well.
A low first-attempt delivery rate can increase the likelihood of additional delivery attempts and RTO, particularly on cash-on-delivery orders, since every failed first attempt also means the cost of a redelivery.
There’s no universal cutoff here. Track it by PIN code and courier instead of relying on one blended national number.
Returns & Reverse Logistics KPIs
Every ecommerce business deals with returns. These two numbers tell you whether yours are a normal cost of doing business or a warning sign.
Return Rate
Return rate is the percentage of delivered orders that customers send back.
Formula: Return Rate = (Returned Orders ÷ Delivered Orders) × 100
- Returned Orders: the number of orders customers sent back within the period you’re measuring
- Delivered Orders: the total number of orders successfully delivered in that same period
Example: Return Rate = (120 ÷ 1,000) × 100 = 12%
This means a seller with 120 returned orders out of 1,000 delivered orders has a 12% return rate.
This is an order-based version of the KPI; some sources calculate return rate against items or products sold instead, so it’s worth being clear about which version you’re tracking.
What counts as normal varies enormously by category and market, with apparel and footwear tending to have higher online return rates because fit and sizing are harder to judge from a product page.
Breaking returns down by reason– wrong size, damaged in transit, changed mind- is what actually tells you where to fix the problem: in product listings, packaging, or expectations set at checkout.
RTO Rate
RTO rate, or return-to-origin rate, is the percentage of dispatched orders that come back to the seller without ever reaching the customer.
Formula: RTO Rate = (RTO Orders ÷ Total Dispatched Orders) × 100
- RTO Orders: shipments that failed delivery and came back to your warehouse
- Total Dispatched Orders: the total number of orders handed over to your delivery partner in the period you’re measuring
Example: RTO Rate = (180 ÷ 1,000) × 100 = 18%
This means a seller with 180 RTO orders out of 1,000 dispatched orders has an 18% RTO rate.
COD orders generally carry higher RTO risk than prepaid orders in India, since there’s no upfront commitment from the buyer. Industry estimates place RTO rates broadly between 20% and 35%, largely driven by cash-on-delivery orders.
RTO can happen on prepaid orders too, from address issues, serviceability gaps, or a customer simply being unavailable. Tracking RTO separately by payment mode usually reveals patterns that a single blended rate hides.
Cost KPIs
Cost per order is the total logistics expense, including warehousing, picking, packing, and shipping, divided by the number of orders fulfilled.
Formula: Cost Per Order = Total Fulfillment Cost ÷ Total Orders Fulfilled
- Total Fulfillment Cost: the combined cost of warehousing, picking, packing, and shipping for the period you’re measuring
- Total Orders Fulfilled: the number of orders shipped out in that same period
Example: Cost Per Order = ₹5,00,000 ÷ 2,500 = ₹200
This means a seller with ₹5,00,000 in total fulfillment costs for the month, across 2,500 orders, spends ₹200 to fulfill each order on average.
Track this separately by weight slab and shipping zone. A single average can hide the fact that remote-zone or heavier shipments are quietly eating your margin on specific products.
India-Specific and Customer Experience KPIs
A handful of metrics matter specifically because of how Indian ecommerce operates: heavy COD usage, wide geographic spread across metro and non-metro pin codes, and customers who expect constant order visibility from the moment they check out.
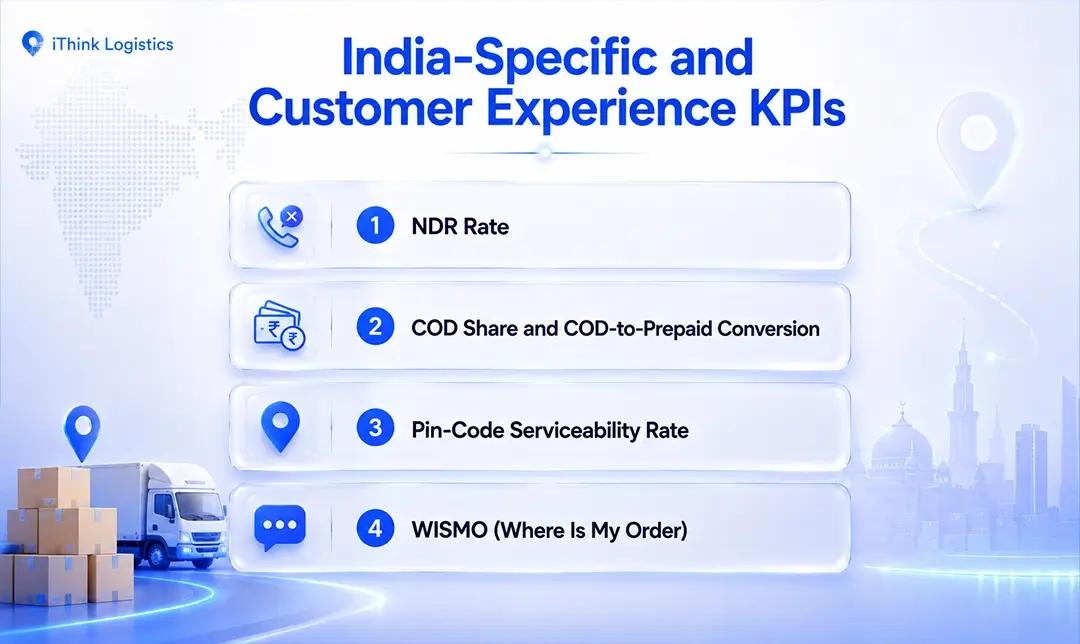
NDR Rate
NDR rate, or non-delivery report rate, tracks the percentage of shipped orders where the courier attempts delivery but fails, and logs a reason back to the seller.
A common way to calculate it: NDR Rate = (NDR Orders ÷ Total Shipped Orders) × 100
- NDR Orders: the number of shipped orders where a delivery attempt failed, and the courier logged a reason
- Total Shipped Orders: the total number of orders shipped out in the period you’re measuring
Example: NDR Rate = (90 ÷ 1,000) × 100 = 9%
This means a seller with 90 NDR-flagged orders out of 1,000 shipped orders has a 9% NDR rate.
Common NDR reasons include the customer being unavailable, an incorrect address, or a refused delivery at the door.
A high NDR rate on a specific courier or PIN code can be an early warning signal for potential RTO. Watch it alongside your RTO numbers rather than after the fact.
COD Share
COD share is the percentage of your total orders placed as cash on delivery rather than prepaid.
Formula: COD Share = (COD Orders ÷ Total Orders) × 100
- COD Orders: the number of orders placed as cash on delivery in the period you’re measuring
- Total Orders: all orders placed in that same period, regardless of payment method
Example: COD Share = (460 ÷ 1,000) × 100 = 46%
This means a seller with 460 COD orders out of 1,000 total orders has a 46% COD share.
COD still accounts for close to half of Indian ecommerce orders as of 2026.
COD-to-Prepaid Conversion
COD-to-prepaid conversion is a seller-defined KPI measuring how many COD orders switch to prepaid when offered an incentive, such as a small discount or cashback.
Formula: COD-to-Prepaid Conversion = (COD Orders Switched to Prepaid ÷ Total COD Orders Offered the Incentive) × 100
- COD Orders Switched to Prepaid: the number of customers who chose prepaid after being offered the incentive
- Total COD Orders Offered the Incentive: the number of customers who saw the incentive at checkout.
Example: COD-to-Prepaid Conversion = (60 ÷ 400) × 100 = 15%
This means that out of 400 customers offered an incentive to switch, 60 chose prepaid instead of COD, a 15% conversion rate.
This is a direct lever for reducing RTO exposure, since COD generally carries higher RTO risk than prepaid, without turning away customers who prefer paying on delivery.
Pin-Code Serviceability Rate
Pin-code serviceability rate is the percentage of Indian pin codes where you can actually offer delivery through your current courier network.
Formula: Serviceability Rate = (Serviceable Pin Codes ÷ Total Target Pin Codes) × 100
- Serviceable Pin Codes: the number of pin codes your current courier network can actually deliver to
- Total Target Pin Codes: the number of pin codes you’re aiming to serve, based on where your customers are
Example: Serviceability Rate = (14,000 ÷ 20,000) × 100 = 70%
This means a seller who can deliver to 14,000 out of a target 20,000 pin codes has a 70% serviceability rate.
A single courier may have serviceability gaps in some locations, particularly outside metro areas.
Using multiple courier partners through an aggregator can expand coverage and reduce dependence on any one network, without the seller having to negotiate separately with each courier.
WISMO (Where Is My Order)
WISMO tracks how many customer support tickets are simply someone asking where their order is.
One way to calculate it: WISMO Rate = (WISMO Tickets ÷ Total Orders) × 100
- WISMO Tickets: the number of support tickets or calls asking about the status of an order already in transit
- Total Orders: the total number of orders placed in the period you’re measuring
Example: WISMO Rate = (25 ÷ 1,000) × 100 = 2.5%
This means a seller with 25 “where is my order” tickets out of 1,000 orders has a 2.5% WISMO rate.
A high WISMO rate can point to gaps in tracking visibility, unclear delivery expectations, poor communication, or genuine delays.
Check which of these is actually driving the tickets before assuming it’s purely a tracking-page problem. Clear, proactive tracking updates can help reduce these inquiries either way.
Which KPIs Should You Track First?
Tracking every KPI in this guide from day one is a recipe for a dashboard nobody actually checks. If you can only monitor a handful consistently, start here.
| KPI | How to Calculate | How to Set Your Benchmark |
| Perfect Order Rate | % on-time × % complete × % damage-free × % accurate documentation | Compare against your own history and relevant peer benchmarks |
| On-Time Delivery Rate | On-time deliveries ÷ total deliveries | Set against your promised delivery SLA |
| RTO Rate | RTO orders ÷ total shipped | Track by payment mode, courier, zone, and category |
| Stockout Rate | Stockout orders ÷ total demand | Set based on your category’s demand pattern and service-level goals |
| First-Attempt Delivery Rate | Delivered on first attempt ÷ total attempts | Compare by courier, zone, and pin code |
| Return Rate | Returned orders ÷ delivered orders | Compare against your category or product benchmark |
| Cost Per Order | Total fulfillment cost ÷ total orders | Monitor the trend and its impact on contribution margin |
| Inventory Turnover | COGS ÷ average inventory | Compare against category peers and your own historical turnover |
| NDR Rate | NDR orders ÷ total shipped | Monitor by courier and pin code, alongside your RTO trend |
| WISMO Rate | WISMO tickets ÷ total orders | Compare against your own historical baseline |
These ten cover the major areas above, including inventory, fulfillment, delivery, returns, cost, and India-specific delivery risks, so a quick weekly check still gives you visibility across the whole operation instead of just one corner of it.
None of these have a single universal cutoff that applies to every seller, which is exactly why comparing against your own trend matters more than chasing an industry-wide number.
How to Build Your KPI Tracking System
Knowing which KPIs matter is only half the job. Here’s how to actually put a tracking system in place.
1. Define Your Goals and Pick 5 to 10 KPIs
Don’t try to track everything in this guide at once. Pick the handful tied directly to what you’re trying to fix this quarter, whether that’s cutting RTO, speeding up dispatch, or reducing stockouts.
Write down the exact formula for each one so nobody on your team ends up calculating it differently.
2. Assign an Owner and Map Where Each Number Comes From
Every KPI needs one person accountable for it, not a shared responsibility that nobody actually checks.
Map exactly where each number originates: your order management system, your courier’s dashboard, your returns desk, so there’s no confusion later about which source is the source of truth.
3. Pick a Tracking Method and Set a Review Cadence
A spreadsheet works fine to start. Pull order status, return data, and courier reason codes- the short codes couriers log when a delivery fails, such as “customer unavailable” or “address incomplete”- into one place weekly, even if it’s manual at first.
Review fast-moving KPIs like dispatch and delivery weekly and slower-moving ones like inventory turnover monthly so you’re not reacting to noise that hasn’t had time to become a real trend.
As order volume grows, manual tracking becomes the bottleneck.
If you’re juggling numbers across multiple couriers at that point, working with a courier aggregator, such as iThink Logistics, can bring RTO, NDR, and delivery data into a single view instead of five separate courier dashboards.
FAQs
What is a good RTO rate for COD orders in India?
There’s no single figure that applies to every seller, since RTO varies by category, geography, and courier. What’s well established is that COD orders generally carry higher RTO risk than prepaid orders, since there’s no upfront payment commitment from the buyer. The figure that matters most is your own trend over time by courier and pin code, since a national average can hide serious pockets of underperformance in specific regions.
How many supply chain KPIs should a small ecommerce brand track?
There’s no fixed universal number, but tracking a small, focused set tied to your actual operational goals works better than trying to monitor everything at once. A small ecommerce brand generally does well starting with one KPI per functional area: inventory, fulfillment, delivery, returns, and cost, then adding more only once those become routine to check.
What is WISMO in ecommerce?
WISMO stands for Where Is My Order, and it’s one of the most common customer inquiries in ecommerce, referring to support tickets or calls asking about the status of a shipment that’s already on its way. A high WISMO rate can point to gaps in tracking visibility, unclear delivery expectations, or genuine delays. Hence, it’s worth checking which of these is actually driving the tickets before assuming it’s just a tracking-page issue.
Bringing It Together
None of these numbers matter in isolation. A strong inventory turnover means little if half those orders come back as RTO, and a fast order-to-ship cycle time doesn’t help if the courier can’t service the pin code it’s headed to.
The real value shows up when you start checking a handful of these together every week, not as a reporting exercise, but as an early warning system that catches problems while they’re still small enough to fix quietly.
Author